WHERE THIS GOES
A flood takes the season. What it often takes with it is the orchard.
Cover in this market is built around a lost harvest, because that is what a loss adjuster can
count. But water that sits on a perennial block, and the silt it leaves behind, does something
slower and more expensive. We can see it in the satellite record: measured against matched blocks
that did not flood, most of the first season's canopy loss on the worst-affected parcels is still
visible three growing seasons later. Two things that is not. It is a measure of greenness rather
than economics, so a replanted block greens up again while the grower waits years for it to bear,
which means it understates the loss rather than overstating it. And it is not a dollar figure: the
index has not been shown to predict what a flood costs.
The season is the insurable event. The asset is the actual loss. Almost nobody covers the
second, and we think that is the product worth building.
Getting there is a measurement problem before it is an insurance one, and we would rather be
plain about the order. Extent, meaning how much of this block went under, is where we are now.
How long
the water stayed, and what it left behind, is where the value is. Each rung has to be measured and
validated before it can be priced, and we will publish where each one stands.
WHY IT DOESN'T ALREADY EXIST
Not for want of satellites. Public flood-mapping services are excellent and largely free, and we
use them as a benchmark. But they were built to direct an emergency response, and that job rewards
a different kind of caution: be certain that mapped water is really there, because crews and
helicopters get sent to it. Caution of that kind is bought at the price of leaving some flooded
ground off the map.
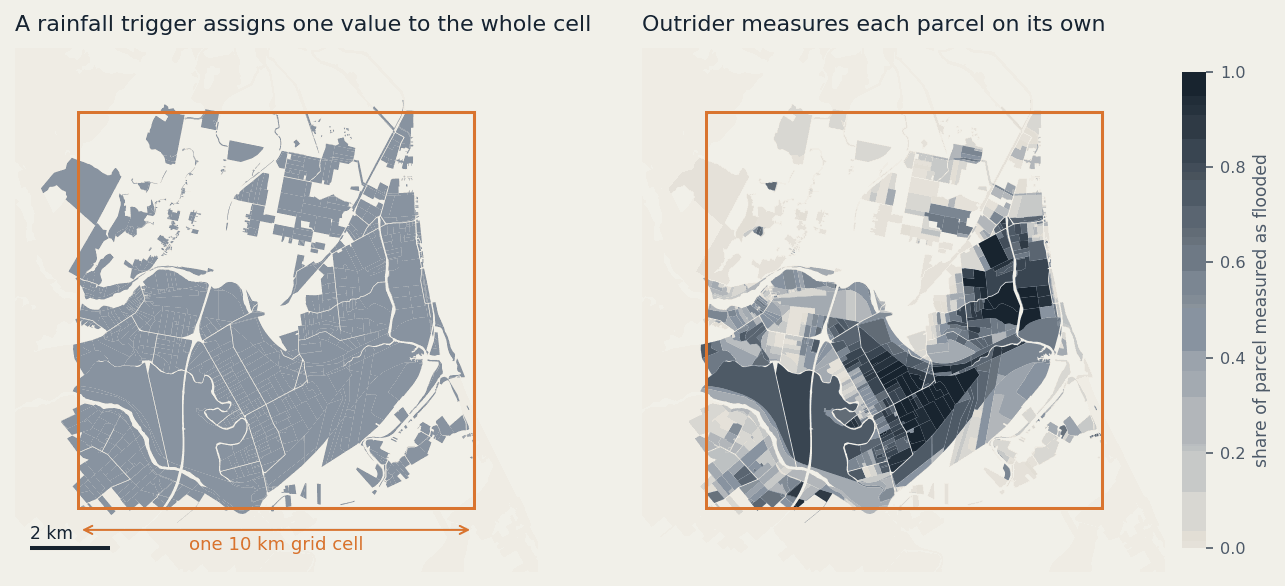
For a response team that is the right trade. For a payment it is the wrong one. An unmapped
flooded block is a grower who paid a premium and gets nothing, which is the failure that
rainfall-triggered products in this market have struggled with. Building the measurement for the
payment, rather than
borrowing one built for the response, is the whole idea.
It is also genuinely hard, which is the more honest reason the category is empty. Our own method
still misses flooding under a closed canopy, and below a certain parcel size the measurement is
too coarse to stand behind. Those limits are measured, published, and the thing we are working on.
HOW WE WORK
Every test is written down before it is run, including what result would count as a failure, and
graded against that document afterwards. Four pre-registered attempts to improve on the current
method were run and graded as no improvement, and were not adopted. A fifth was invalidated by a
bug in our own evaluation harness, and is recorded as unresolved rather than disproven.
Numbers here have moved down as often as up. When one does, it gets corrected in public with the
reason. For an audience that underwrites uncertainty for a living, we think that is worth more than
a clean figure. It is the same discipline that has to hold when a payout is disputed.
WHO WE'D LIKE TO HEAR FROM
Growers and their advisers. Particularly anyone who was under water in 2023
and can tell us what the cover did and did not do.
Insurers and brokers who have looked at parametric cover here, whatever the
conclusion. The ones who tried it and stopped have learned things we would rather not learn
twice.
Anyone holding a flood loss record. This is the useful one. A dozen historical
claims with a date, a location and an amount paid would tell us more about whether this index
tracks real money than any amount of further satellite work. We would happily test against it and
show you exactly where it fails.